
- Published on
- Last updated:
NestJS tracing with Open Telemetry: A how-to guide with examples

This tutorial is a deep dive into implementing tracing in NestJS using the open-source observability tool Open Telemetry.
To get the most out of this tutorial, I recommend coding along!
If you want to check out the code for this tutorial, here's the Github repo.
Ready? Let's go!

Table of Contents
A primer on Observability
Imagine you build a rocket and send it into space 🚀.
The chance of failure is very high, so it would be smart if you could stream and emit relevant data to measure the rocket's performance so that you can learn from any failures and improve the rocket for the next launch.
Similarly, if you have a NestJS application deployed to production, you'll want to be able to monitor the performance of your application and easily debug any issues that arise.
Implementing 'Observability' is how you can achieve this.
This description from the Observability Engineering book sums up Observability well:
"Our definition of 'observability' for software systems is a measure of how well you can understand and explain any state your system can get into, no matter how novel or bizarre."
So how can we implement Observability in our NestJS applications?
That's where Open Telemetry comes in.
What is Open Telemetry?
Open Telemetry (commonly known as Otel) is a vendor-neutral open-source project that provides a single set of APIs, libraries, agents, and collector services to capture distributed traces and metrics from your application.
You can think of Observability as the theory and Open Telemetry as the practice.
When learning about Open Telemetry, you'll see 'instrumentation' comes up a lot.
What does this mean? Instrumentation means your code emits 'signals' (typically traces, metrics and logs) that can be sent to an Observability back-end.
Let's dive into how you can set up Open Telemetry in a NestJS application.
How to set up automatic tracing in NestJS
We're going to set up a global tracer that will automatically emit telemetry data from a NestJS application as requests come into the server.
First, let's install some Open Telemetry packages we'll need:
npm install @opentelemetry/sdk-node @opentelemetry/sdk-trace-base
Add a new file to your project called tracing.ts:
touch src/tracing.ts
Now let's add some code to set up the global tracer using the packages we just installed:
import {
  ConsoleSpanExporter,
  SimpleSpanProcessor,
} from '@opentelemetry/sdk-trace-base';
import { NodeSDK } from '@opentelemetry/sdk-node';
import * as process from 'process';

const traceExporter = new ConsoleSpanExporter();

export const otelSDK = new NodeSDK({
  spanProcessor: new SimpleSpanProcessor(traceExporter),
  instrumentations: [],
});

// gracefully shut down the SDK on process exit
process.on('SIGTERM', () => {
  otelSDK
    .shutdown()
    .then(
      () => console.log('SDK shut down successfully'),
      (err) => console.log('Error shutting down SDK', err),
    )
    .finally(() => process.exit(0));
});
The ConsoleSpanExporter class will log the traces to the console so we can validate that everything is working. Later in this tutorial, we'll use a tool to visualize these traces in the browser.
If you look inside the otelSDK variable, you'll see that the instrumentations property has an empty array. We'll need to configure this further in order for the NestJS app to auto-emit telemetry data.
Inside the instrumentations property, you can use Otel's autoinstrumenatation modules to define what you want to auto instrument.
To start with, let's install the http and express modules:
npm install @opentelemetry/instrumentation-express @opentelemetry/instrumentation-http
And then use them inside the instrumentations property:
import {
  ConsoleSpanExporter,
  SimpleSpanProcessor,
} from '@opentelemetry/sdk-trace-base';
import { NodeSDK } from '@opentelemetry/sdk-node';
import * as process from 'process';
import { HttpInstrumentation } from '@opentelemetry/instrumentation-http';
import { ExpressInstrumentation } from '@opentelemetry/instrumentation-express';

const traceExporter = new ConsoleSpanExporter();

export const otelSDK = new NodeSDK({
  spanProcessor: new SimpleSpanProcessor(traceExporter),
  instrumentations: [new HttpInstrumentation(), new ExpressInstrumentation()],
});

// gracefully shut down the SDK on process exit
process.on('SIGTERM', () => {
  otelSDK
    .shutdown()
    .then(
      () => console.log('SDK shut down successfully'),
      (err) => console.log('Error shutting down SDK', err),
    )
    .finally(() => process.exit(0));
});
Next, we need to import and call otelSDK in the bootstrapping of the NestJS application.
Open up your main.ts file and call the start() function on the SDK:
// Make sure to import the SDK before any other modules
import { otelSDK } from './tracing-test';
import { NestFactory } from '@nestjs/core';
import { AppModule } from './app.module';

async function bootstrap() {
  // Start SDK before nestjs factory create
  await otelSDK.start();
  const app = await NestFactory.create(AppModule);
  await app.listen(8080);
}
bootstrap();
Important: Make sure you import the SDK before any other modules and also start the SDK as the first function call inside the bootstrap function!
To check the tracing is working, start your local server with npm run start:dev and make an HTTP request into your server. You'll see a trace printed to the logs:

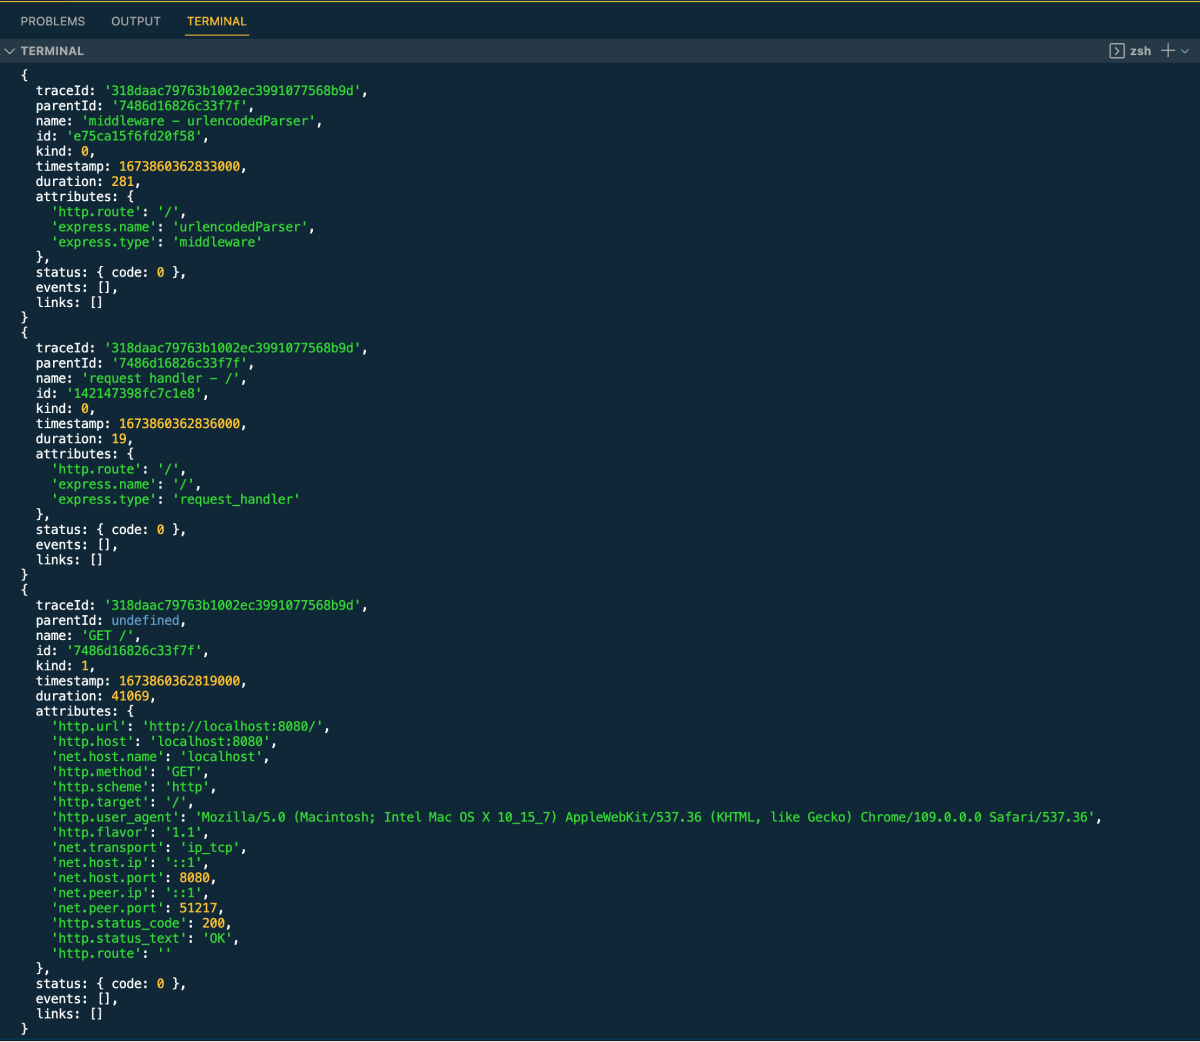
Nice one! Your NestJS app now auto-emits telemetry data that prints this data to the console.
Right now, we're just using the http and express auto instrumentation modules from Otel, however, there are plenty of other modules that might be relevant to your project. For example:
- Redis
- Postgres
- Graphql
- And many more!
One module that's worth including is the official Otel NestJS instrumentation package that auto-emits NestJS controller related telemetry data. Let's install that now:
npm install @opentelemetry/instrumentation-nestjs-core
And include it in our array of instrumentations:
import {
  ConsoleSpanExporter,
  SimpleSpanProcessor,
} from '@opentelemetry/sdk-trace-base';
import { NodeSDK } from '@opentelemetry/sdk-node';
import * as process from 'process';
import { HttpInstrumentation } from '@opentelemetry/instrumentation-http';
import { ExpressInstrumentation } from '@opentelemetry/instrumentation-express';
import { NestInstrumentation } from '@opentelemetry/instrumentation-nestjs-core';

const traceExporter = new ConsoleSpanExporter();

export const otelSDK = new NodeSDK({
  spanProcessor: new SimpleSpanProcessor(traceExporter),
  instrumentations: [
    new HttpInstrumentation(),
    new ExpressInstrumentation(),
    new NestInstrumentation(),
  ],
});

// gracefully shut down the SDK on process exit
process.on('SIGTERM', () => {
  otelSDK
    .shutdown()
    .then(
      () => console.log('SDK shut down successfully'),
      (err) => console.log('Error shutting down SDK', err),
    )
    .finally(() => process.exit(0));
});
Another layer of config that's worth adding is naming the service that's being traced so that if/when you have multiple services running they are easily distinguishable.
This requires a couple of packages:
npm install @opentelemetry/semantic-conventions @opentelemetry/resources
And then updating the tracing setup to name the service:
import {
  ConsoleSpanExporter,
  SimpleSpanProcessor,
} from '@opentelemetry/sdk-trace-base';
import { NodeSDK } from '@opentelemetry/sdk-node';
import * as process from 'process';
import { HttpInstrumentation } from '@opentelemetry/instrumentation-http';
import { ExpressInstrumentation } from '@opentelemetry/instrumentation-express';
import { NestInstrumentation } from '@opentelemetry/instrumentation-nestjs-core';
import { Resource } from '@opentelemetry/resources';
import { SemanticResourceAttributes } from '@opentelemetry/semantic-conventions';

const traceExporter = new ConsoleSpanExporter();

export const otelSDK = new NodeSDK({
  resource: new Resource({
    [SemanticResourceAttributes.SERVICE_NAME]: `nestjs-otel`, // update this to a more relevant name for you!
  }),
  spanProcessor: new SimpleSpanProcessor(traceExporter),
  instrumentations: [
    new HttpInstrumentation(),
    new ExpressInstrumentation(),
    new NestInstrumentation(),
  ],
});

// gracefully shut down the SDK on process exit
process.on('SIGTERM', () => {
  otelSDK
    .shutdown()
    .then(
      () => console.log('SDK shut down successfully'),
      (err) => console.log('Error shutting down SDK', err),
    )
    .finally(() => process.exit(0));
});
Pro tip: If you're working on a monorepo with multiple NestJS services running, it would be a good idea to wrap the above tracing code into a function that takes the service name as an argument to centralize your tracing setup.
Visualize traces in local development with Jaeger
Viewing traces in the console confirms that the tracing is up and running, but to get the full benefits of tracing we need a tool to help monitor and troubleshoot multiple requests that hit our server.
This is where Jaeger comes in - an open-source distributed tracing system from Uber (you can read more about Jaeger's history here).
There's a couple of ways we can set up Jaeger (both require Docker to be installed on your machine).
The quickest way is open a new tab in your terminal and run:
docker run -d --name jaeger \
  -e COLLECTOR_ZIPKIN_HOST_PORT=:9411 \
  -e COLLECTOR_OTLP_ENABLED=true \
  -p 6831:6831/udp \
  -p 6832:6832/udp \
  -p 5778:5778 \
  -p 16686:16686 \
  -p 4317:4317 \
  -p 4318:4318 \
  -p 14250:14250 \
  -p 14268:14268 \
  -p 14269:14269 \
  -p 9411:9411 \
  jaegertracing/all-in-one:1.41
Alternatively, you can use Docker Compose. If you don't have one already, add a Docker Compose file to your project:
touch docker-compose.yml
And then add the following:
services:
  tracing:
    image: jaegertracing/all-in-one:latest
    ports:
      - 6831:6831/udp
      - 6832:6832/udp
      - 5778:5778
      - 16686:16686
      - 4317:4317
      - 4318:4318
      - 14250:14250
      - 14268:14268
      - 14269:14269
      - 9411:9411
To spin up the local Jaeger server, run the command:
docker compose up -d
If you now visit http://localhost:16686/ in your browser, you'll see Jaeger:

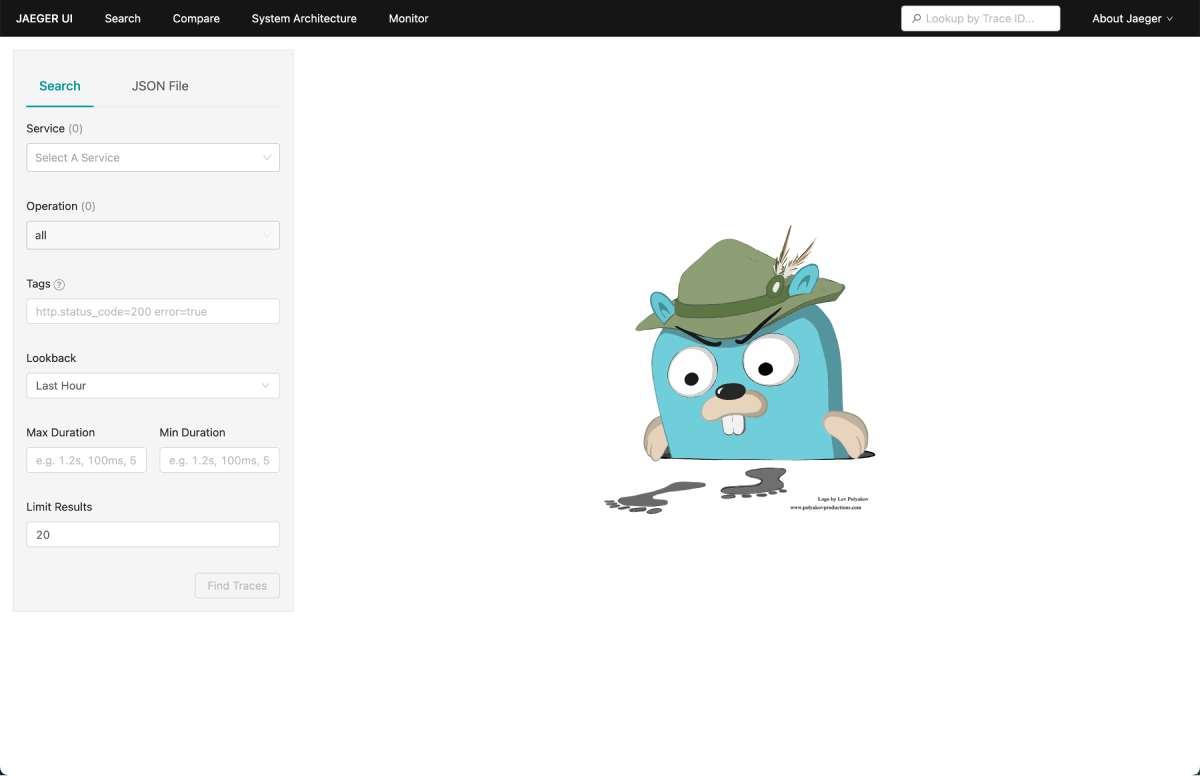
Next, we need to tweak our tracing setup to send the traces to Jaeger instead of the console.
First, we need to install the Jaeger package:
npm install @opentelemetry/exporter-jaeger
And then inside the tracing setup file, let's replace the ConsoleSpanExporter() with the Jaeger config:
import {
  SimpleSpanProcessor,
} from '@opentelemetry/sdk-trace-base';
import { NodeSDK } from '@opentelemetry/sdk-node';
import * as process from 'process';
import { HttpInstrumentation } from '@opentelemetry/instrumentation-http';
import { ExpressInstrumentation } from '@opentelemetry/instrumentation-express';
import { NestInstrumentation } from '@opentelemetry/instrumentation-nestjs-core';
import { Resource } from '@opentelemetry/resources';
import { SemanticResourceAttributes } from '@opentelemetry/semantic-conventions';
import { JaegerExporter } from '@opentelemetry/exporter-jaeger';

const jaegerExporter = new JaegerExporter({
  endpoint: 'http://localhost:14268/api/traces',
});

const traceExporter = jaegerExporter;

export const otelSDK = new NodeSDK({
  resource: new Resource({
    [SemanticResourceAttributes.SERVICE_NAME]: `nestjs-otel`,
  }),
  spanProcessor: new SimpleSpanProcessor(traceExporter),
  instrumentations: [
    new HttpInstrumentation(),
    new ExpressInstrumentation(),
    new NestInstrumentation(),
  ],
});

// gracefully shut down the SDK on process exit
process.on('SIGTERM', () => {
  otelSDK
    .shutdown()
    .then(
      () => console.log('SDK shut down successfully'),
      (err) => console.log('Error shutting down SDK', err),
    )
    .finally(() => process.exit(0));
});
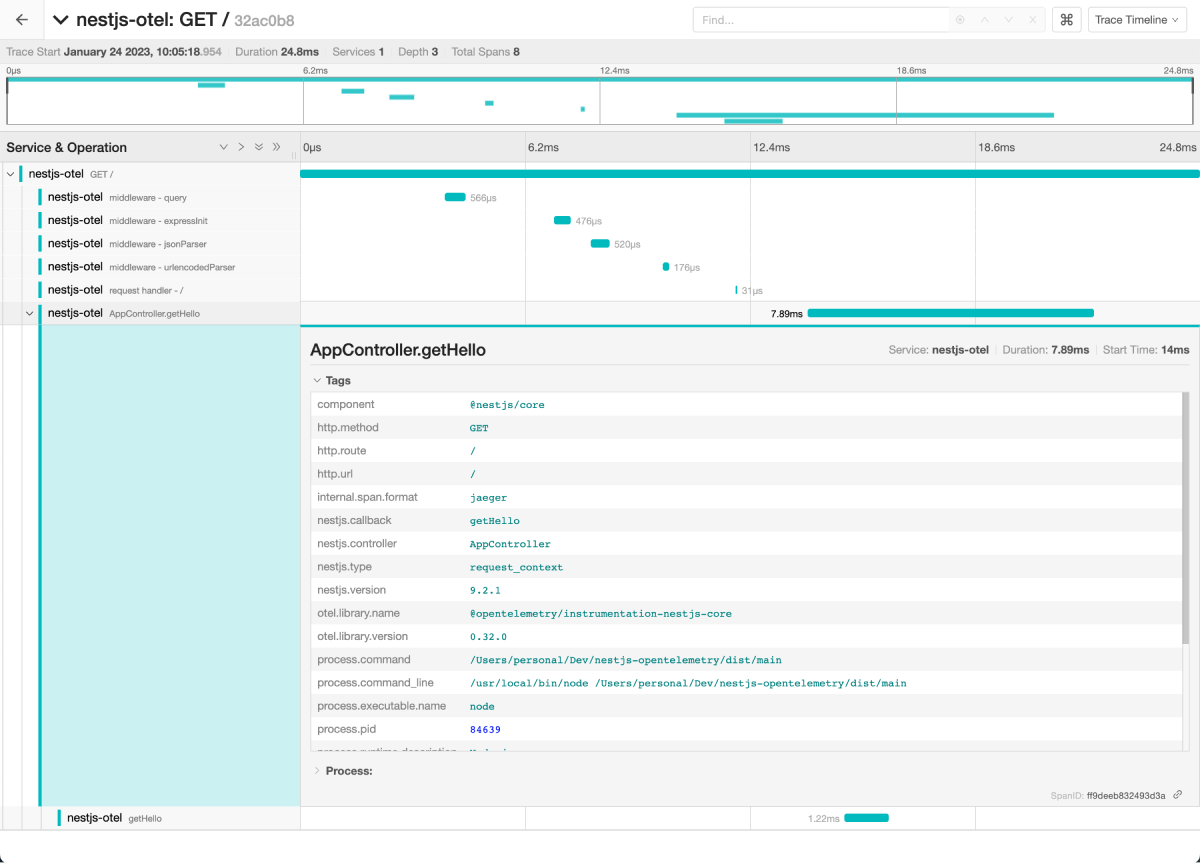
Start your local server with npm run start:dev and make a request into your server.
Then open up your local Jaeger instance (http://localhost:16686/), choose the service from the dropdown and press the Find Traces button.
You should see the trace of the request that hit your server!

Optimizing tracing performance
A quick note on performance.
If your application is processing lots and lots of traces, you can make a small tweak in your Open Telemetry configuration to ensure there is minimal performance impact (particularly for deployed environments).
The small tweak is this: instead of the spans of a trace being processed one by one, process them in batches.
Let's apply this batching in deployed environments only using the BatchSpanProcessor class from the @opentelemetry/sdk-trace-base package:
import {
  BatchSpanProcessor,
  SimpleSpanProcessor,
} from '@opentelemetry/sdk-trace-base';
import { NodeSDK } from '@opentelemetry/sdk-node';
import * as process from 'process';
import { HttpInstrumentation } from '@opentelemetry/instrumentation-http';
import { ExpressInstrumentation } from '@opentelemetry/instrumentation-express';
import { NestInstrumentation } from '@opentelemetry/instrumentation-nestjs-core';
import { Resource } from '@opentelemetry/resources';
import { SemanticResourceAttributes } from '@opentelemetry/semantic-conventions';
import { JaegerExporter } from '@opentelemetry/exporter-jaeger';
// Don't forget to import the dotenv package!
import * as dotenv from 'dotenv';

const jaegerExporter = new JaegerExporter({
  endpoint: 'http://localhost:14268/api/traces',
});

const traceExporter = jaegerExporter;

const spanProcessor =
  process.env.NODE_ENV === `development`
    ? new SimpleSpanProcessor(traceExporter)
    : new BatchSpanProcessor(traceExporter);

export const otelSDK = new NodeSDK({
  resource: new Resource({
    [SemanticResourceAttributes.SERVICE_NAME]: `nestjs-otel`,
  }),
  spanProcessor,
  instrumentations: [
    new HttpInstrumentation(),
    new ExpressInstrumentation(),
    new NestInstrumentation(),
  ],
});

// gracefully shut down the SDK on process exit
process.on('SIGTERM', () => {
  otelSDK
    .shutdown()
    .then(
      () => console.log('SDK shut down successfully'),
      (err) => console.log('Error shutting down SDK', err),
    )
    .finally(() => process.exit(0));
});
Please note: Because the global tracer is called before the creation of the Nest instance (inside the main.ts file), you'll need to make sure the dotenv package is imported if you want to use any environment variables in the tracing file.
Nice work! Let's move on to tracing in production.
Tracing NestJS apps in production
Jaeger is a pretty great tool and works well in local development, but lacks advanced tooling for in-depth analysis and segmentation which is exactly what you'll need in distributed production environments.
This is where Honeycomb comes in - one of the leading observability tools (which also has a free plan!).
The great thing, however, about Open Telemetry is that its vendor agnostic. So the config can easily be tweaked if you decide to change the observability vendor down the line.
To send the tracing data in deployed environments to Honeycomb we need to install a new package:
npm install @opentelemetry/exporter-trace-otlp-proto
And we're going to update the tracer to send the telemetry data to Jaeger in local environments and to Honeycomb in deployed environments:
import {
  SimpleSpanProcessor,
} from '@opentelemetry/sdk-trace-base';
import { NodeSDK } from '@opentelemetry/sdk-node';
import * as process from 'process';
import { HttpInstrumentation } from '@opentelemetry/instrumentation-http';
import { ExpressInstrumentation } from '@opentelemetry/instrumentation-express';
import { NestInstrumentation } from '@opentelemetry/instrumentation-nestjs-core';
import { Resource } from '@opentelemetry/resources';
import { SemanticResourceAttributes } from '@opentelemetry/semantic-conventions';
import { JaegerExporter } from '@opentelemetry/exporter-jaeger';
// Don't forget to import the dotenv package!
import * as dotenv from 'dotenv';

const jaegerExporter = new JaegerExporter({
  endpoint: 'http://localhost:14268/api/traces',
});

const oltpExporter = new OTLPTraceExporter({
  url: `https://api.honeycomb.io/v1/traces`,
  headers: {
    'x-honeycomb-team': process.env.HONEYCOMB_API_KEY,
  },
});

const traceExporter =
  process.env.NODE_ENV === `development`
    ? jaegerExporter
    : oltpExporter;

export const otelSDK = new NodeSDK({
  resource: new Resource({
    [SemanticResourceAttributes.SERVICE_NAME]: `nestjs-otel`,
  }),
  spanProcessor: new SimpleSpanProcessor(traceExporter),
  instrumentations: [
    new HttpInstrumentation(),
    new ExpressInstrumentation(),
    new NestInstrumentation(),
  ],
});

// gracefully shut down the SDK on process exit
process.on('SIGTERM', () => {
  otelSDK
    .shutdown()
    .then(
      () => console.log('SDK shut down successfully'),
      (err) => console.log('Error shutting down SDK', err),
    )
    .finally(() => process.exit(0));
});
The final step is to add the relevant Honeycomb configuration to the .env file:
HONEYCOMB_API_KEY="YOUR_API_KEY"
Instead of using Jaeger for local tracing, you could set up a new environment inside Honeycomb dedicated for local development. I've found this approach to work well (and means less Docker set up locally).
Once you've deployed the above tracer and set the relevant environment variables in your hosting provider, run an HTTP request and you'll see the trace show up in Honeycomb.
Read on if you're NestJS application is deployed to Cloud Run or other GCP services like Cloud Functions or App Engine.
If you're using one of these GCP services, they will automatically trace the HTTP requests for you.
This is quite handy but is problematic if you want to use a 3rd party vendor like Honeycomb.
Thanks to Lynn Romich who ran into this problem and shared a couple of ways around this.
Option 1 (the hacky way) is to discard any headers Cloud Trace is setting by adding some config to the HTTP instrumentation:
instrumentations: [
    new HttpInstrumentation({
      startIncomingSpanHook: (req) => {
        delete req.headers.traceparent;
        delete req.headers[`x-cloud-trace-context`];
        delete req.headers[`grpc-trace-bin`];
        return {};
      },
    }),
    // ...
  ],
Option 2 (the better way) is to use the B3 Propogator rather than the default W3C Propagator.
This requires a new package install:
npm install @opentelemetry/propagator-b3
And inside the tracing file, set the global propagator to B3:
import {
  SimpleSpanProcessor,
} from '@opentelemetry/sdk-trace-base';
import { api, NodeSDK } from '@opentelemetry/sdk-node';
import * as process from 'process';
import { HttpInstrumentation } from '@opentelemetry/instrumentation-http';
import { ExpressInstrumentation } from '@opentelemetry/instrumentation-express';
import { NestInstrumentation } from '@opentelemetry/instrumentation-nestjs-core';
import { Resource } from '@opentelemetry/resources';
import { SemanticResourceAttributes } from '@opentelemetry/semantic-conventions';
import { JaegerExporter } from '@opentelemetry/exporter-jaeger';
import { B3Propagator } from '@opentelemetry/propagator-b3';
// Don't forget to import the dotenv package!
import * as dotenv from 'dotenv';

const jaegerExporter = new JaegerExporter({
  endpoint: 'http://localhost:14268/api/traces',
});

const oltpExporter = new OTLPTraceExporter({
  url: `https://api.honeycomb.io/v1/traces`,
  headers: {
    'x-honeycomb-team': process.env.HONEYCOMB_API_KEY,
  },
});

const traceExporter =
  process.env.NODE_ENV === `development`
    ? jaegerExporter
    : oltpExporter;

// Set B3 Propagator
api.propagation.setGlobalPropagator(new B3Propagator());

export const otelSDK = new NodeSDK({
  resource: new Resource({
    [SemanticResourceAttributes.SERVICE_NAME]: `nestjs-otel`,
  }),
  spanProcessor: new SimpleSpanProcessor(traceExporter),
  instrumentations: [
    new HttpInstrumentation(),
    new ExpressInstrumentation(),
    new NestInstrumentation(),
  ],
});

// gracefully shut down the SDK on process exit
process.on('SIGTERM', () => {
  otelSDK
    .shutdown()
    .then(
      () => console.log('SDK shut down successfully'),
      (err) => console.log('Error shutting down SDK', err),
    )
    .finally(() => process.exit(0));
});
And that's it! Happy tracing 🔭.